portfolio > operations
Operations
Process, Operations & Analytics
Examples of strategic planning, process management, presentation of ideas, and successful results.
*Click on the images to see the actual material or document.
Typical Workproducts and Results
Documentation
• Workflows
• Cross-functional Assignments
• Time Requirements
• Related Processes
• Documents used/required
• Roles and Responsibilities Matrix
• Decision Matrix
• Receivables and Deliverables
• Managing Strategies
• Metrics and Measurements
• Budget and Expenses
Impacts
• Efficiency
• Accountability
• Communication
• Quality of Work
• Client Satisfaction
• Reduced Costs
• Turnaround Time
• Reduced Sales Cycle Time
Improved
• Cross-functional Operations
• Use of Resources
• Decision Making
• Deliverable Turnaround
• Planning and Process
• Process Measurements/Metrics
• Project Tracking
• Quality Control Process
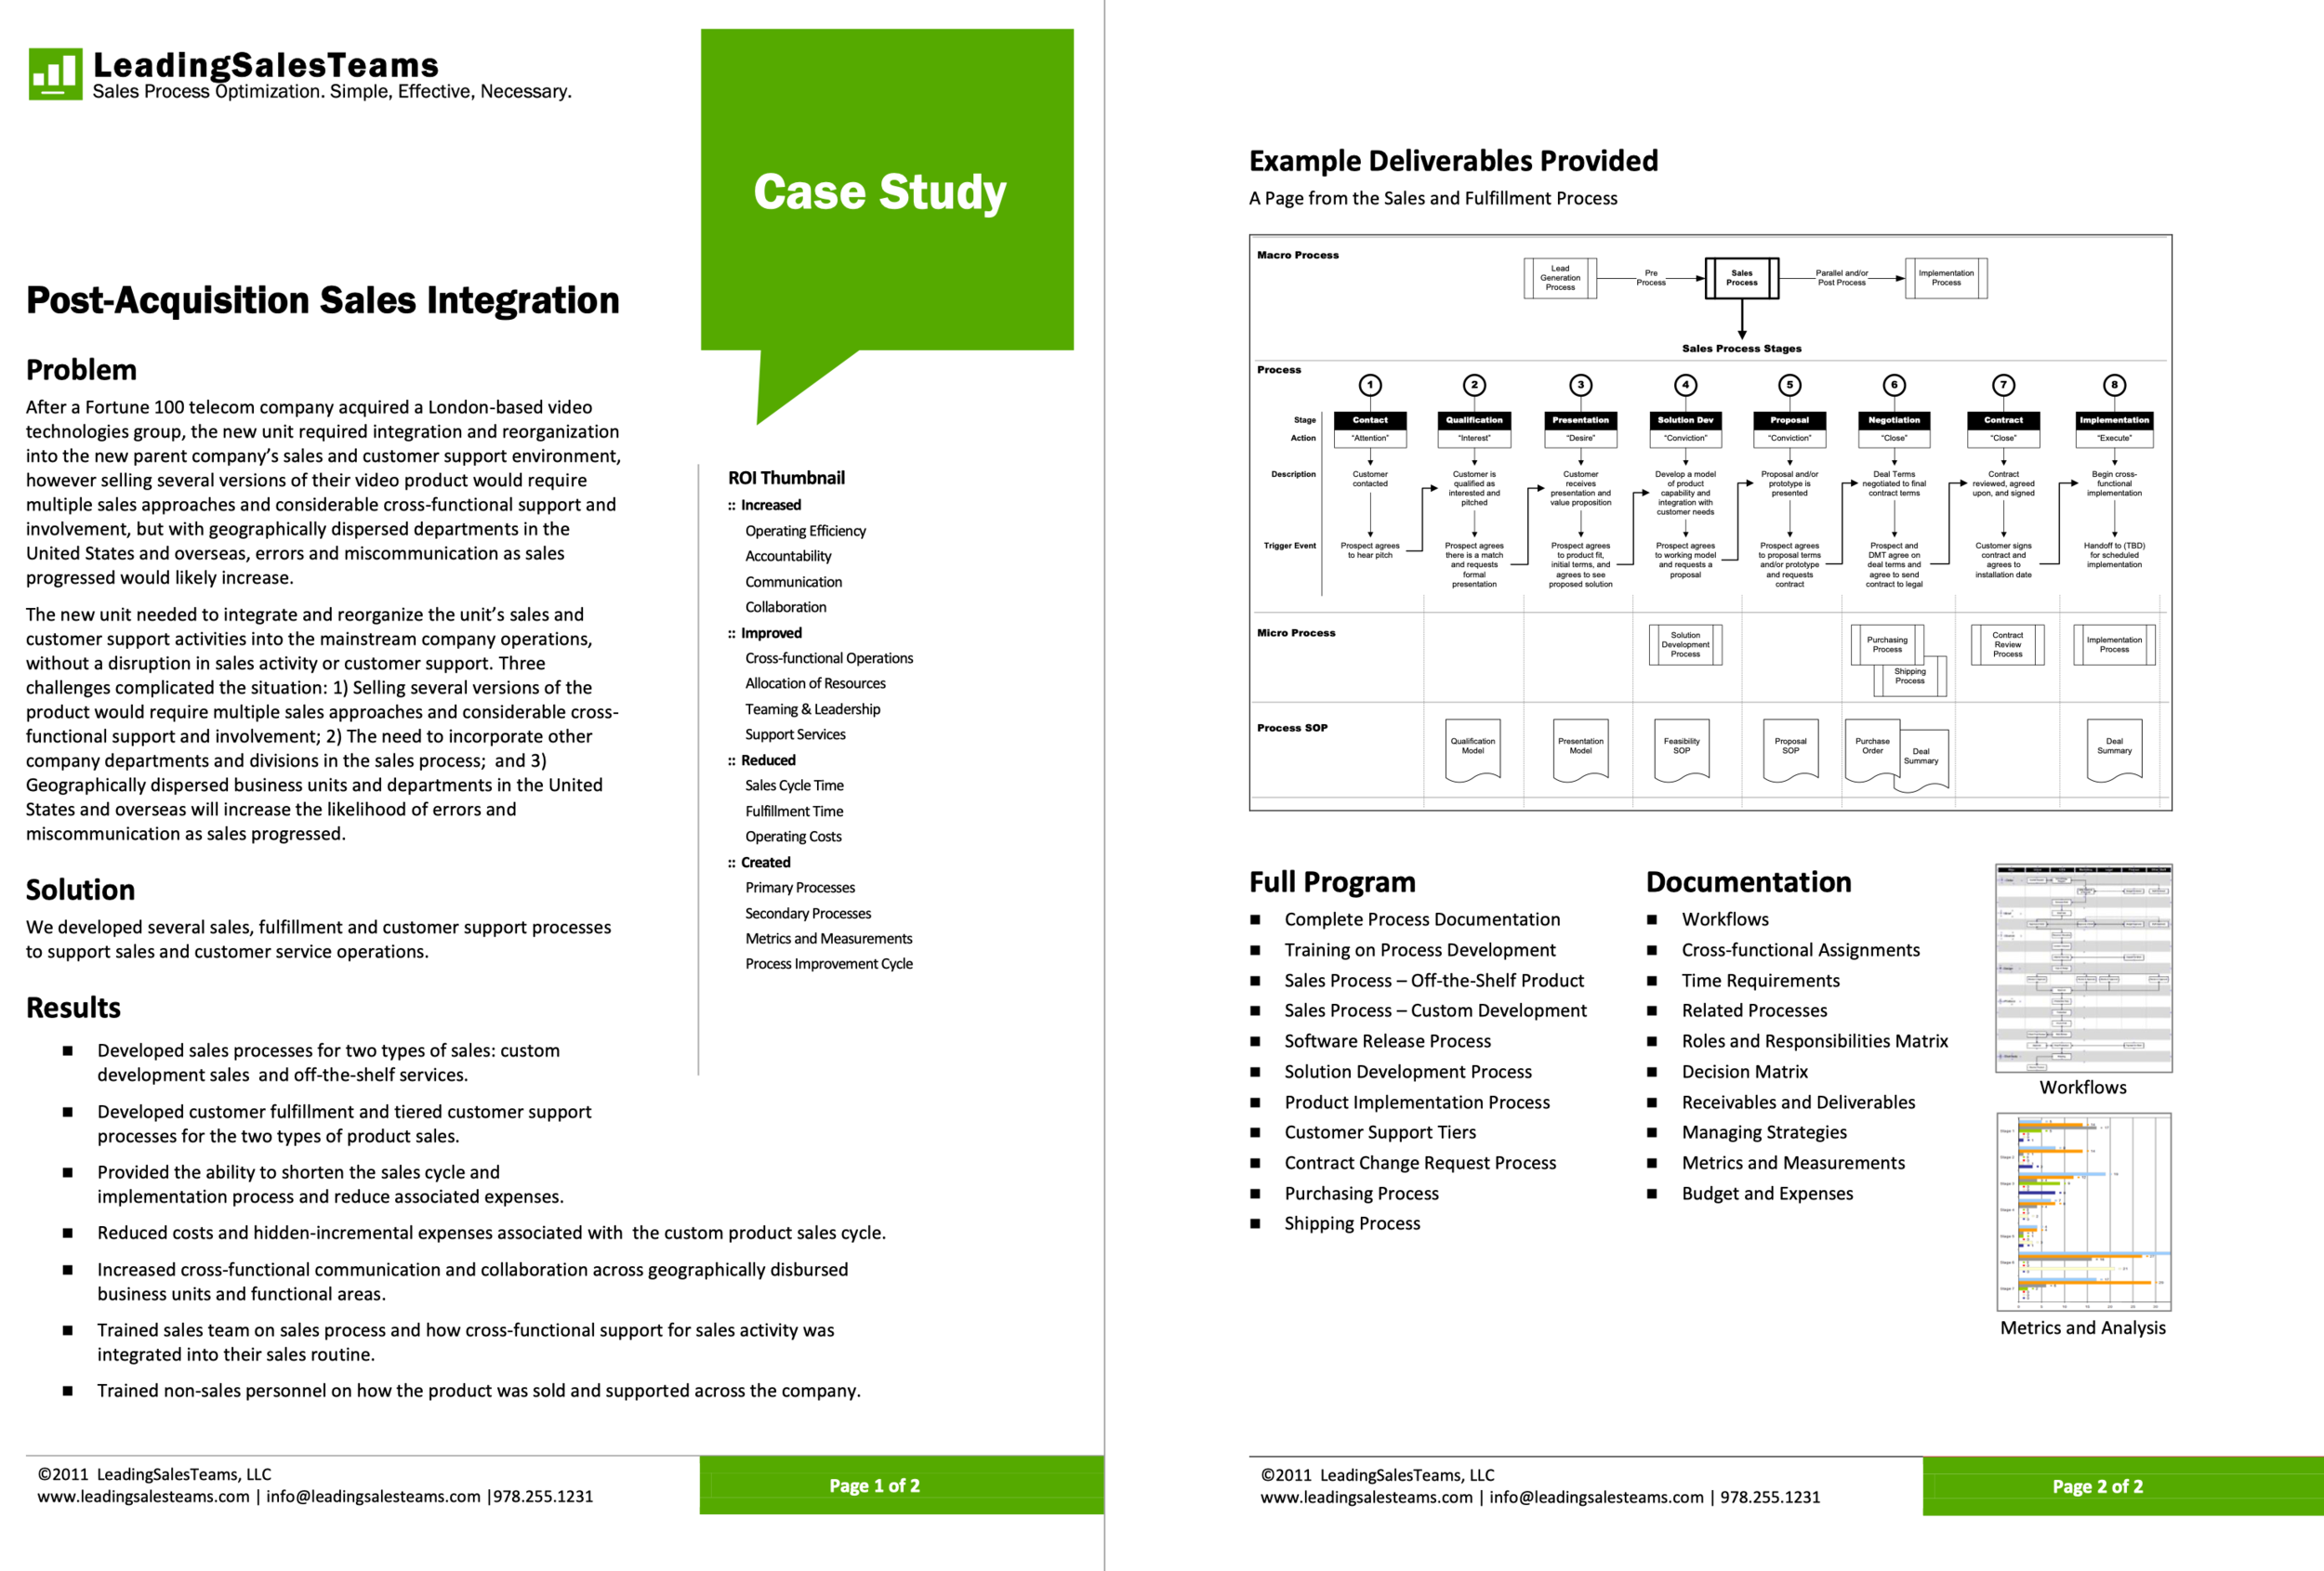
Acquisition Integration Workflow: MCI/Verizon
Mapping the product and sales support process between partners and providers.
Summary
MCI’s Digital Media Technologies Group (DMTG), a start-up unit of MCI following the acquisition of a video technologies company, needed a process and project plan for the new unit’s sales fulfillment and customer support activities.
I developed a cross-functional sales and customer support process for the Digital Media Technologies group, and subsequently integrated the acquired digital media company’s departments into our current operations.
The result was a macro and micro business process map and SOP to support sales and customer support operations for DMTG.
Below is a sample of the various materials, work products, and workflows that were created.
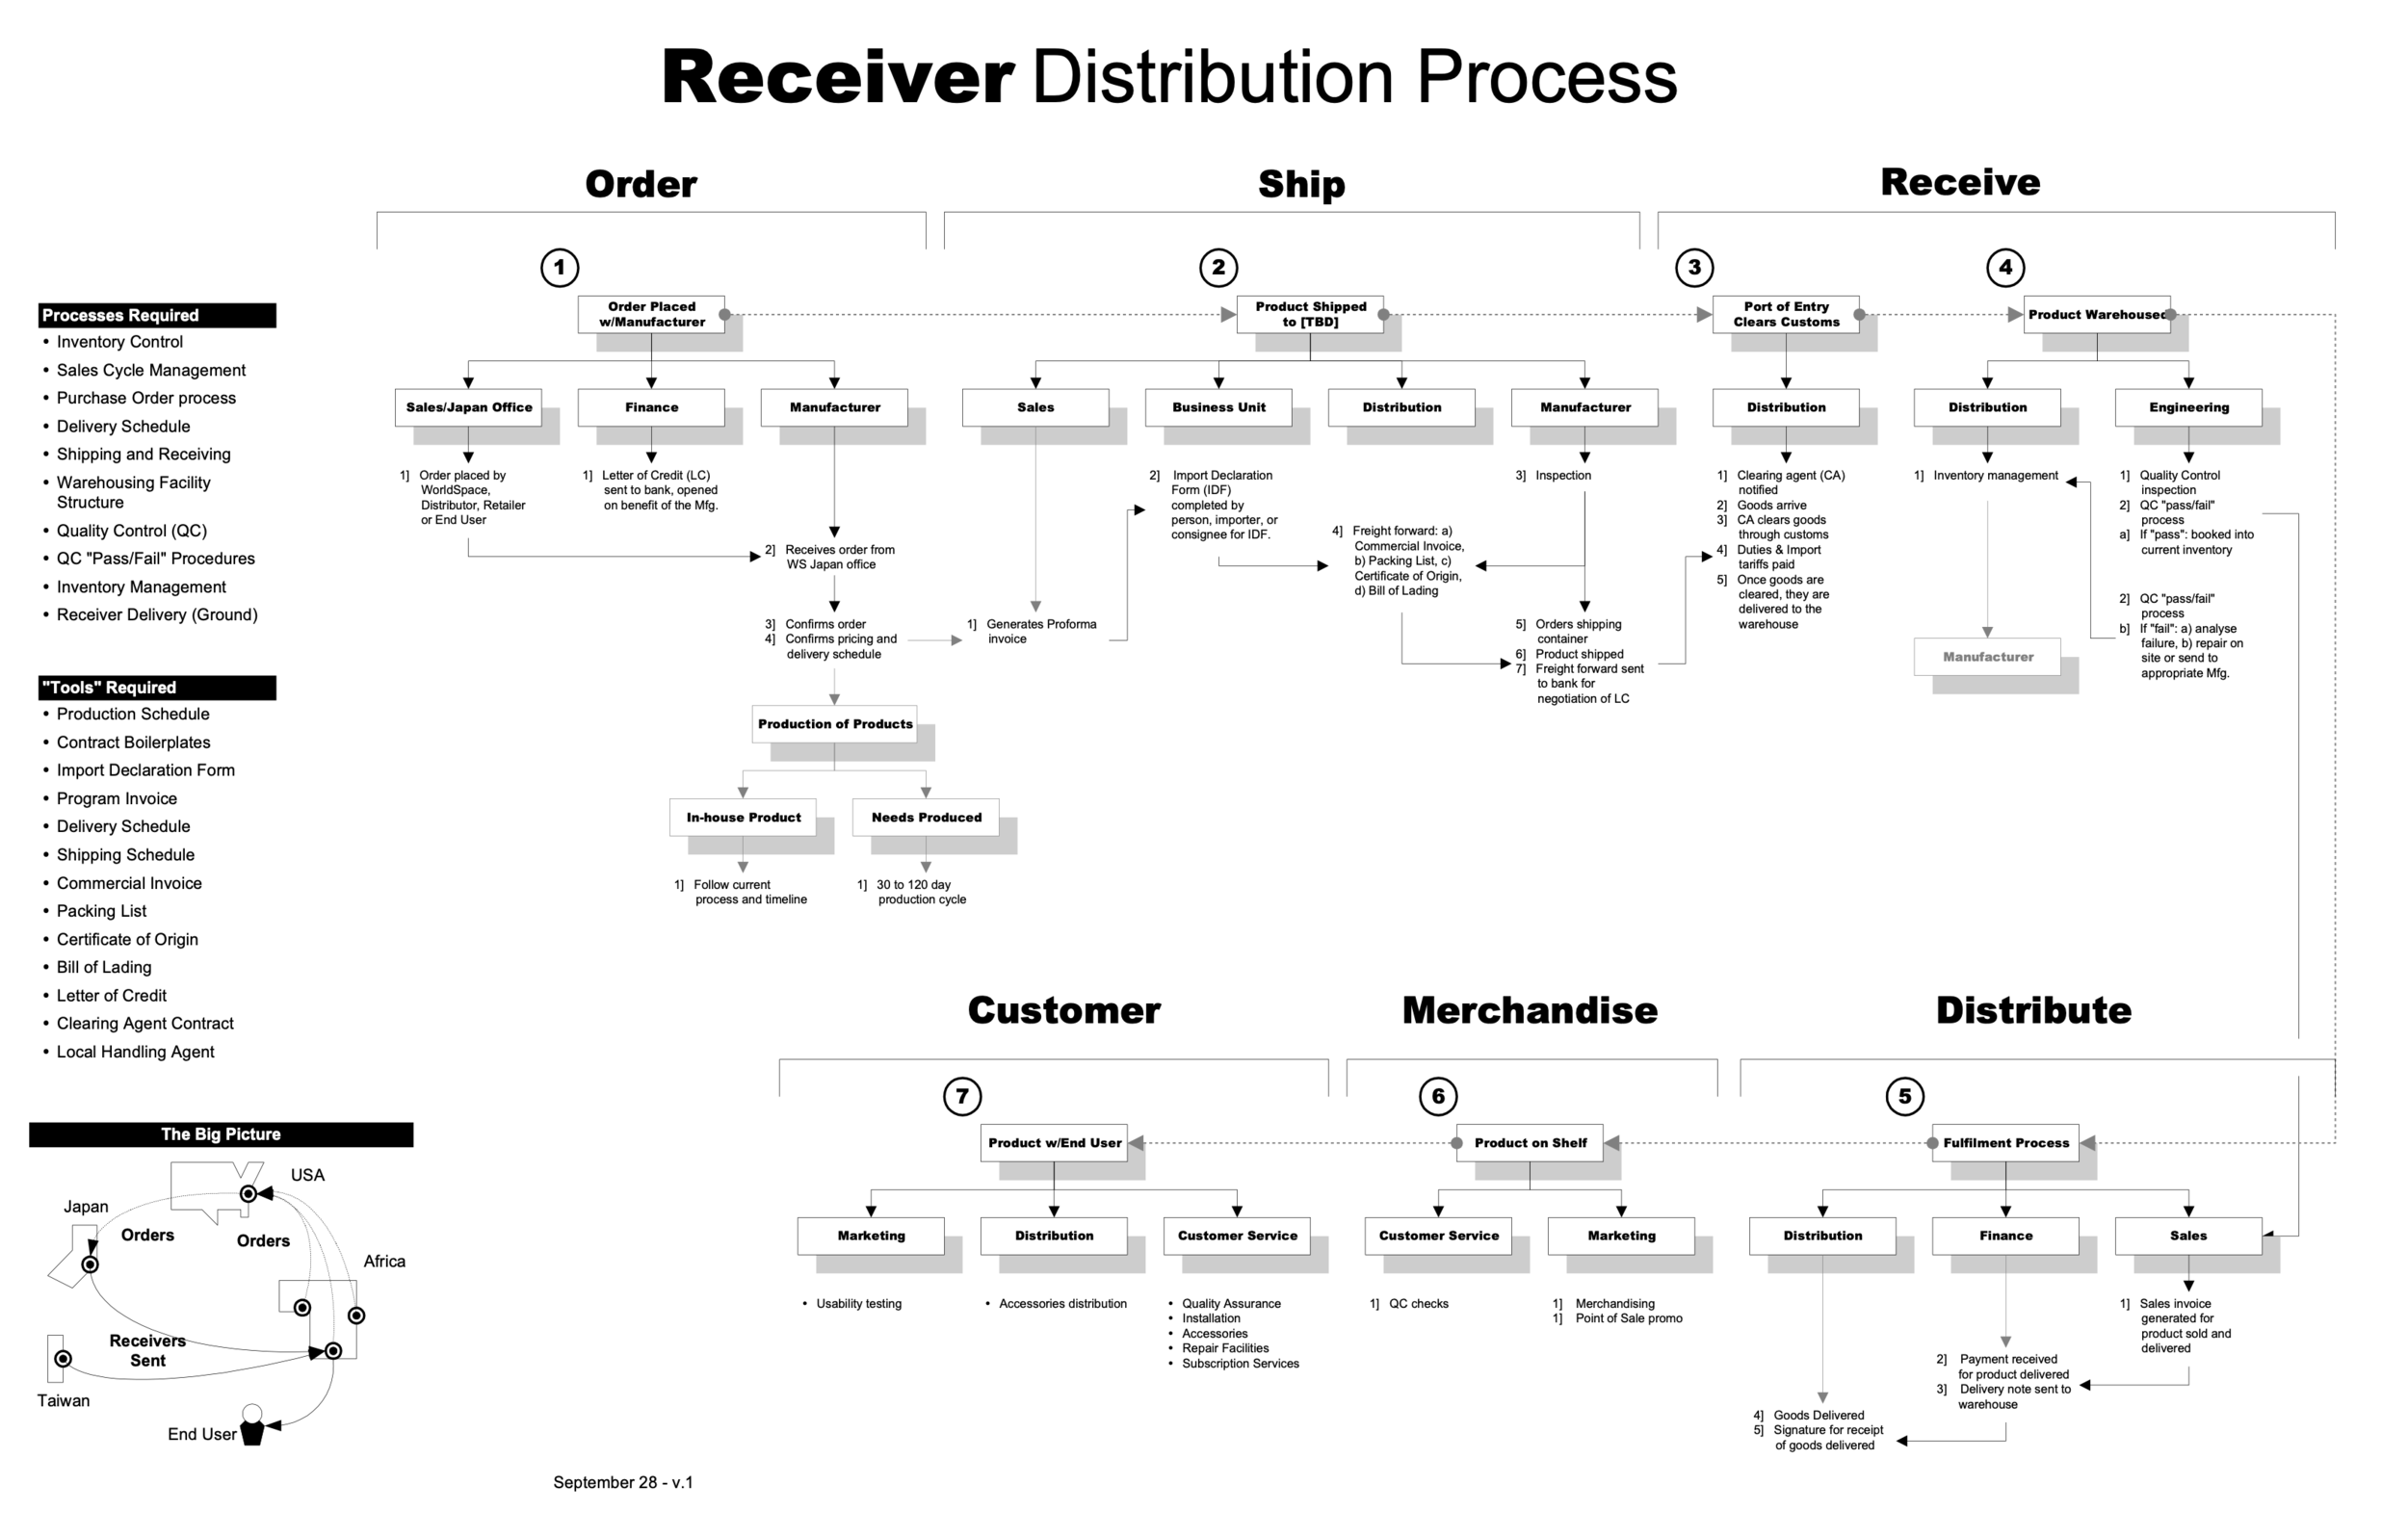
Worldspace Global Product Distribution Process
Mapping Shipments of Radios from Japan to South Africa
Summary
WorldSpace is an international broadcast company providing audio and multimedia content via satellite delivery across Asia, Africa, Europe, the Middle East and Latin America.
The Distribution department was responsible for ordering, shipping, and delivering the company's product from manufacturing facilities in Japan, through cargo transport agencies in Singapore, to warehouses in Africa, Asia, and the Middle East, and finally, to regional product distributors and local retailers that were supported by the company's regional business units.
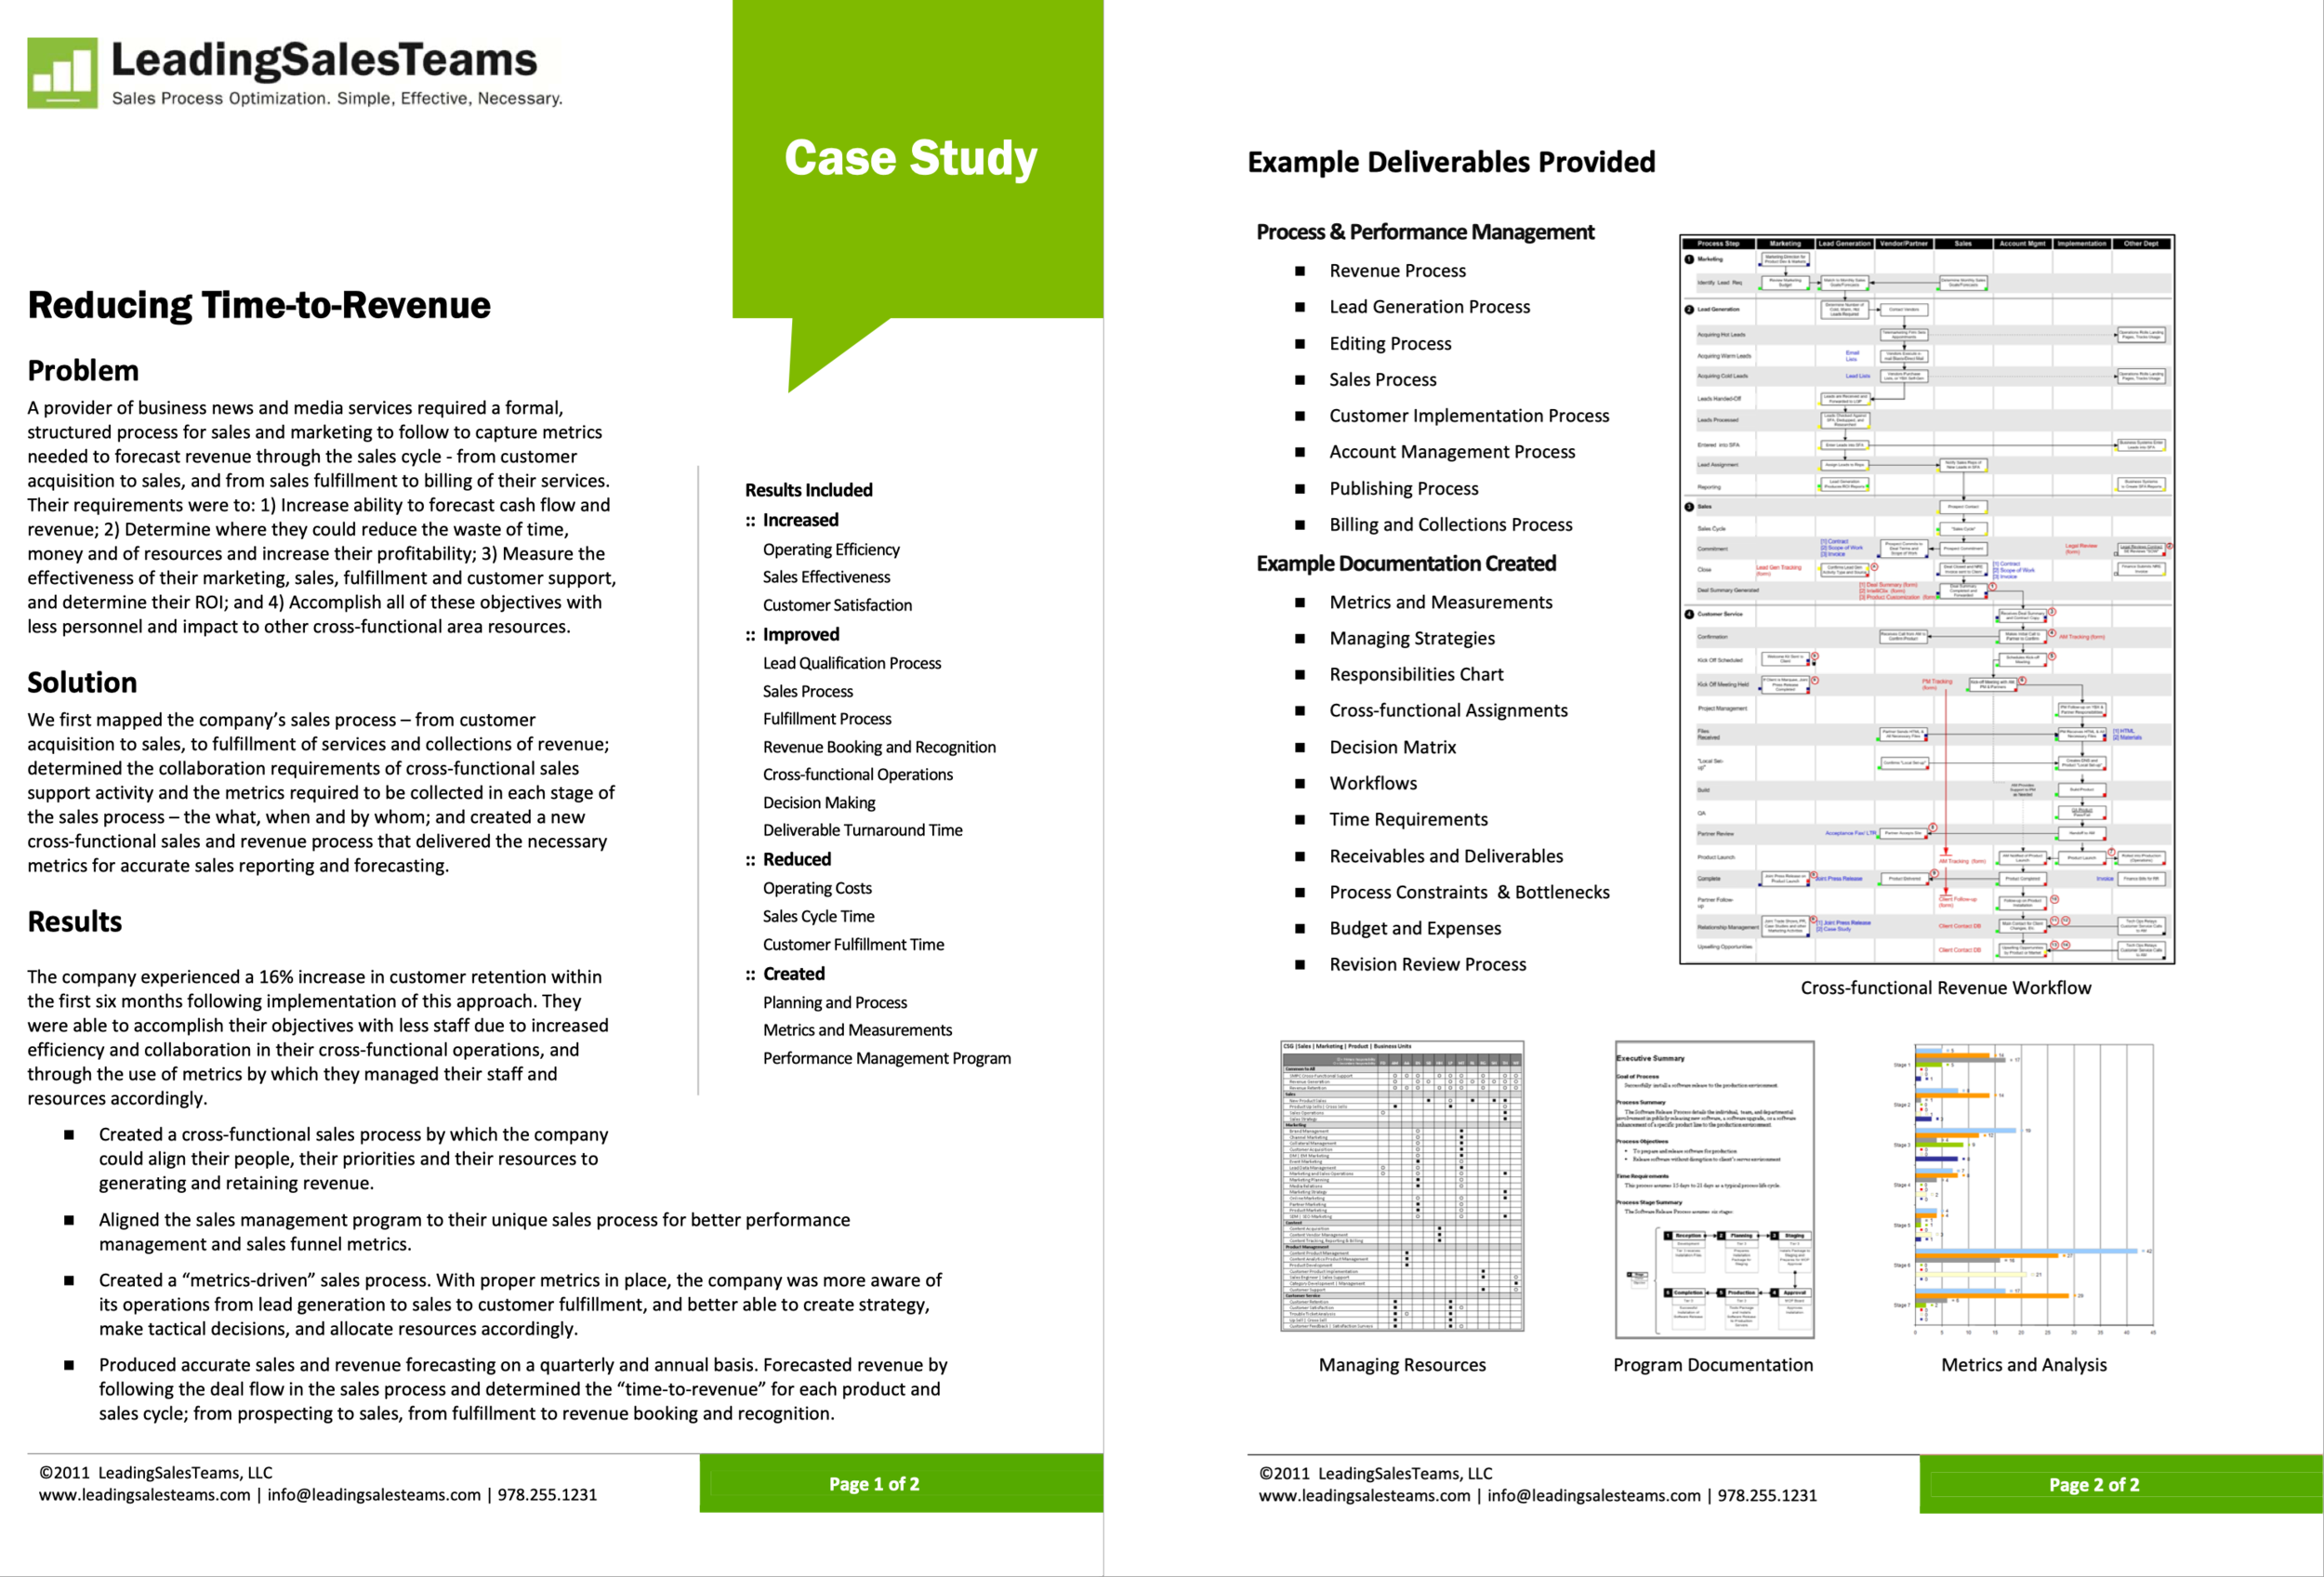
Reducing Time-to-Revenue
Mapping sales and customer service processes.
Case Study Improving Sales Workflow
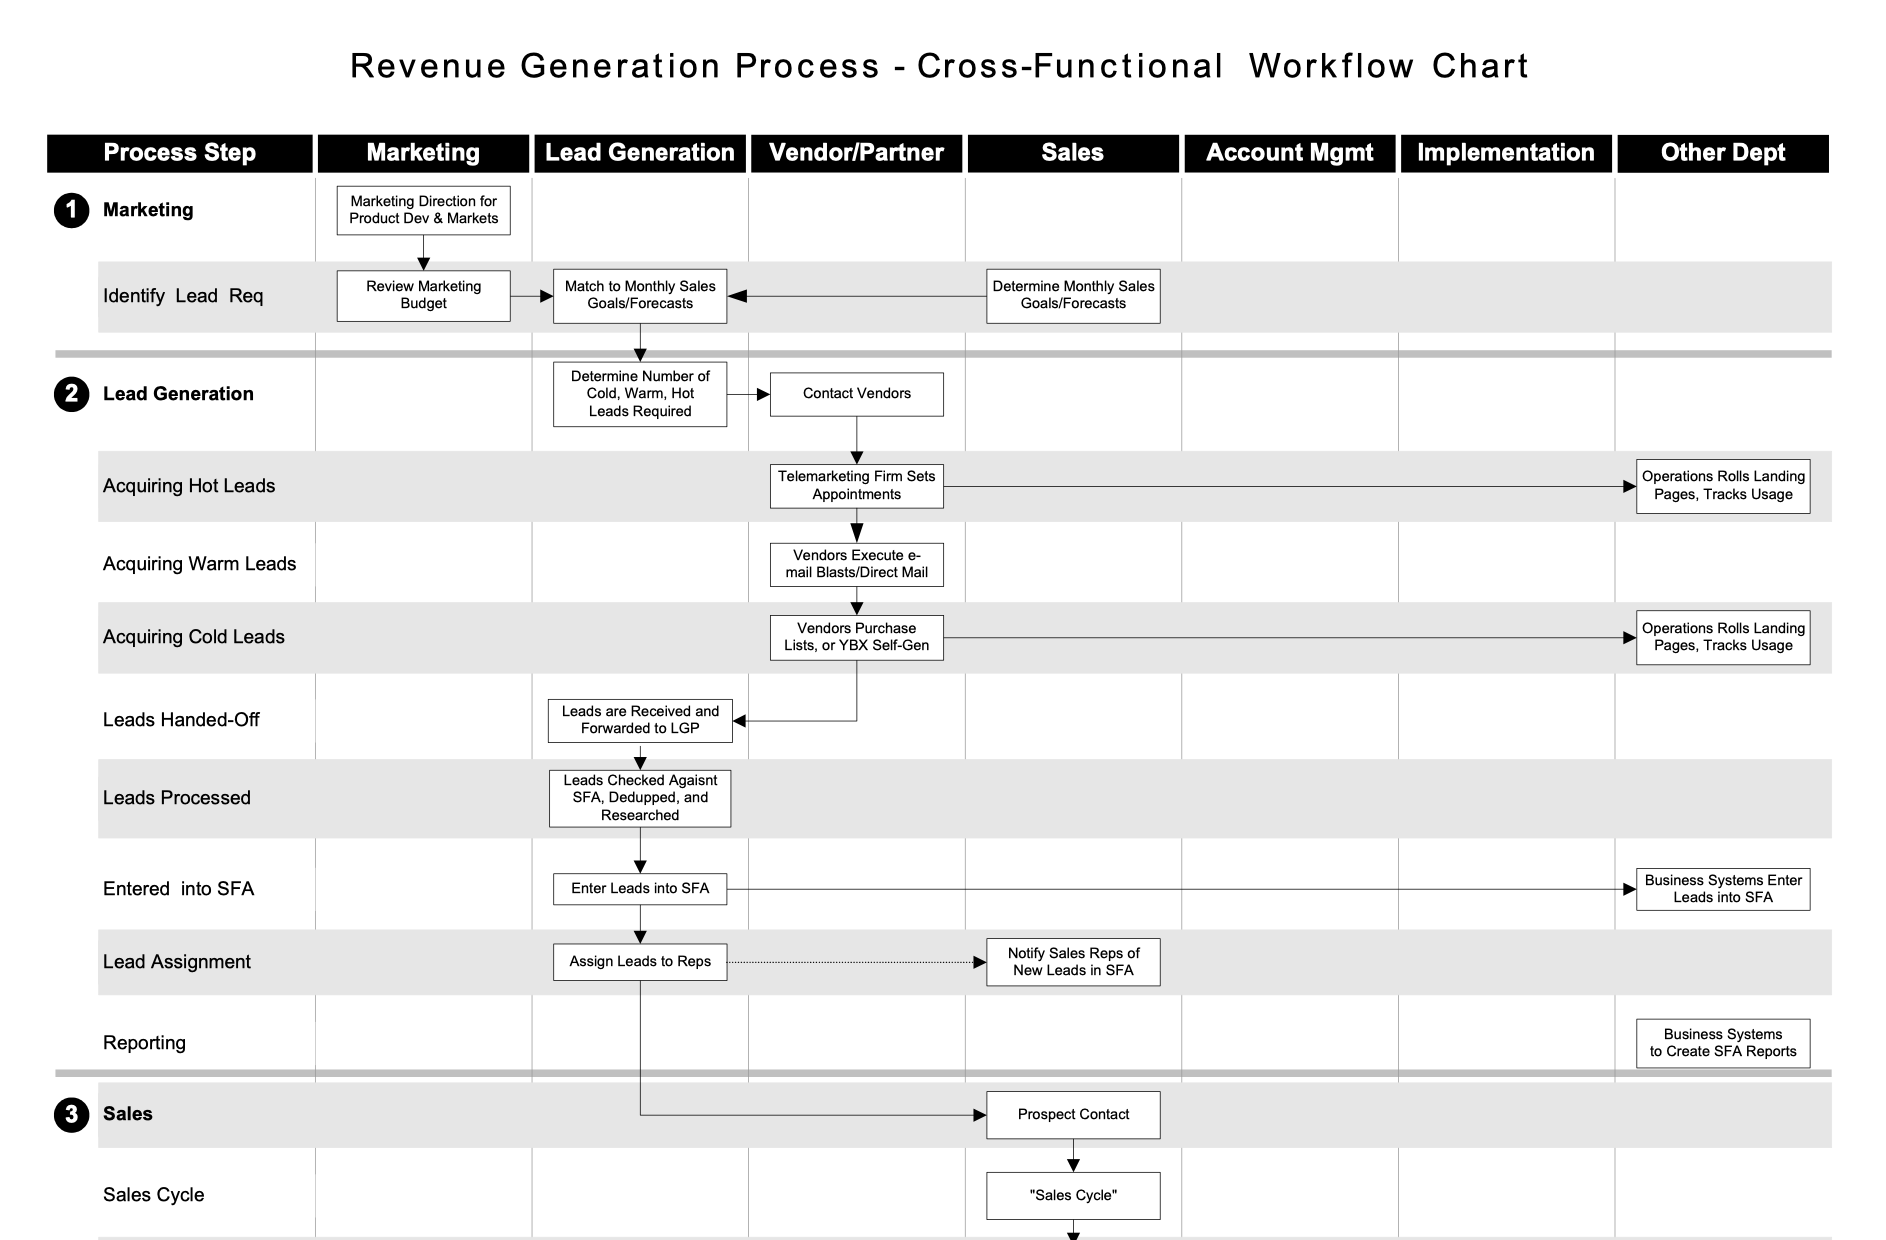
Sales Cross-Functional Workflow
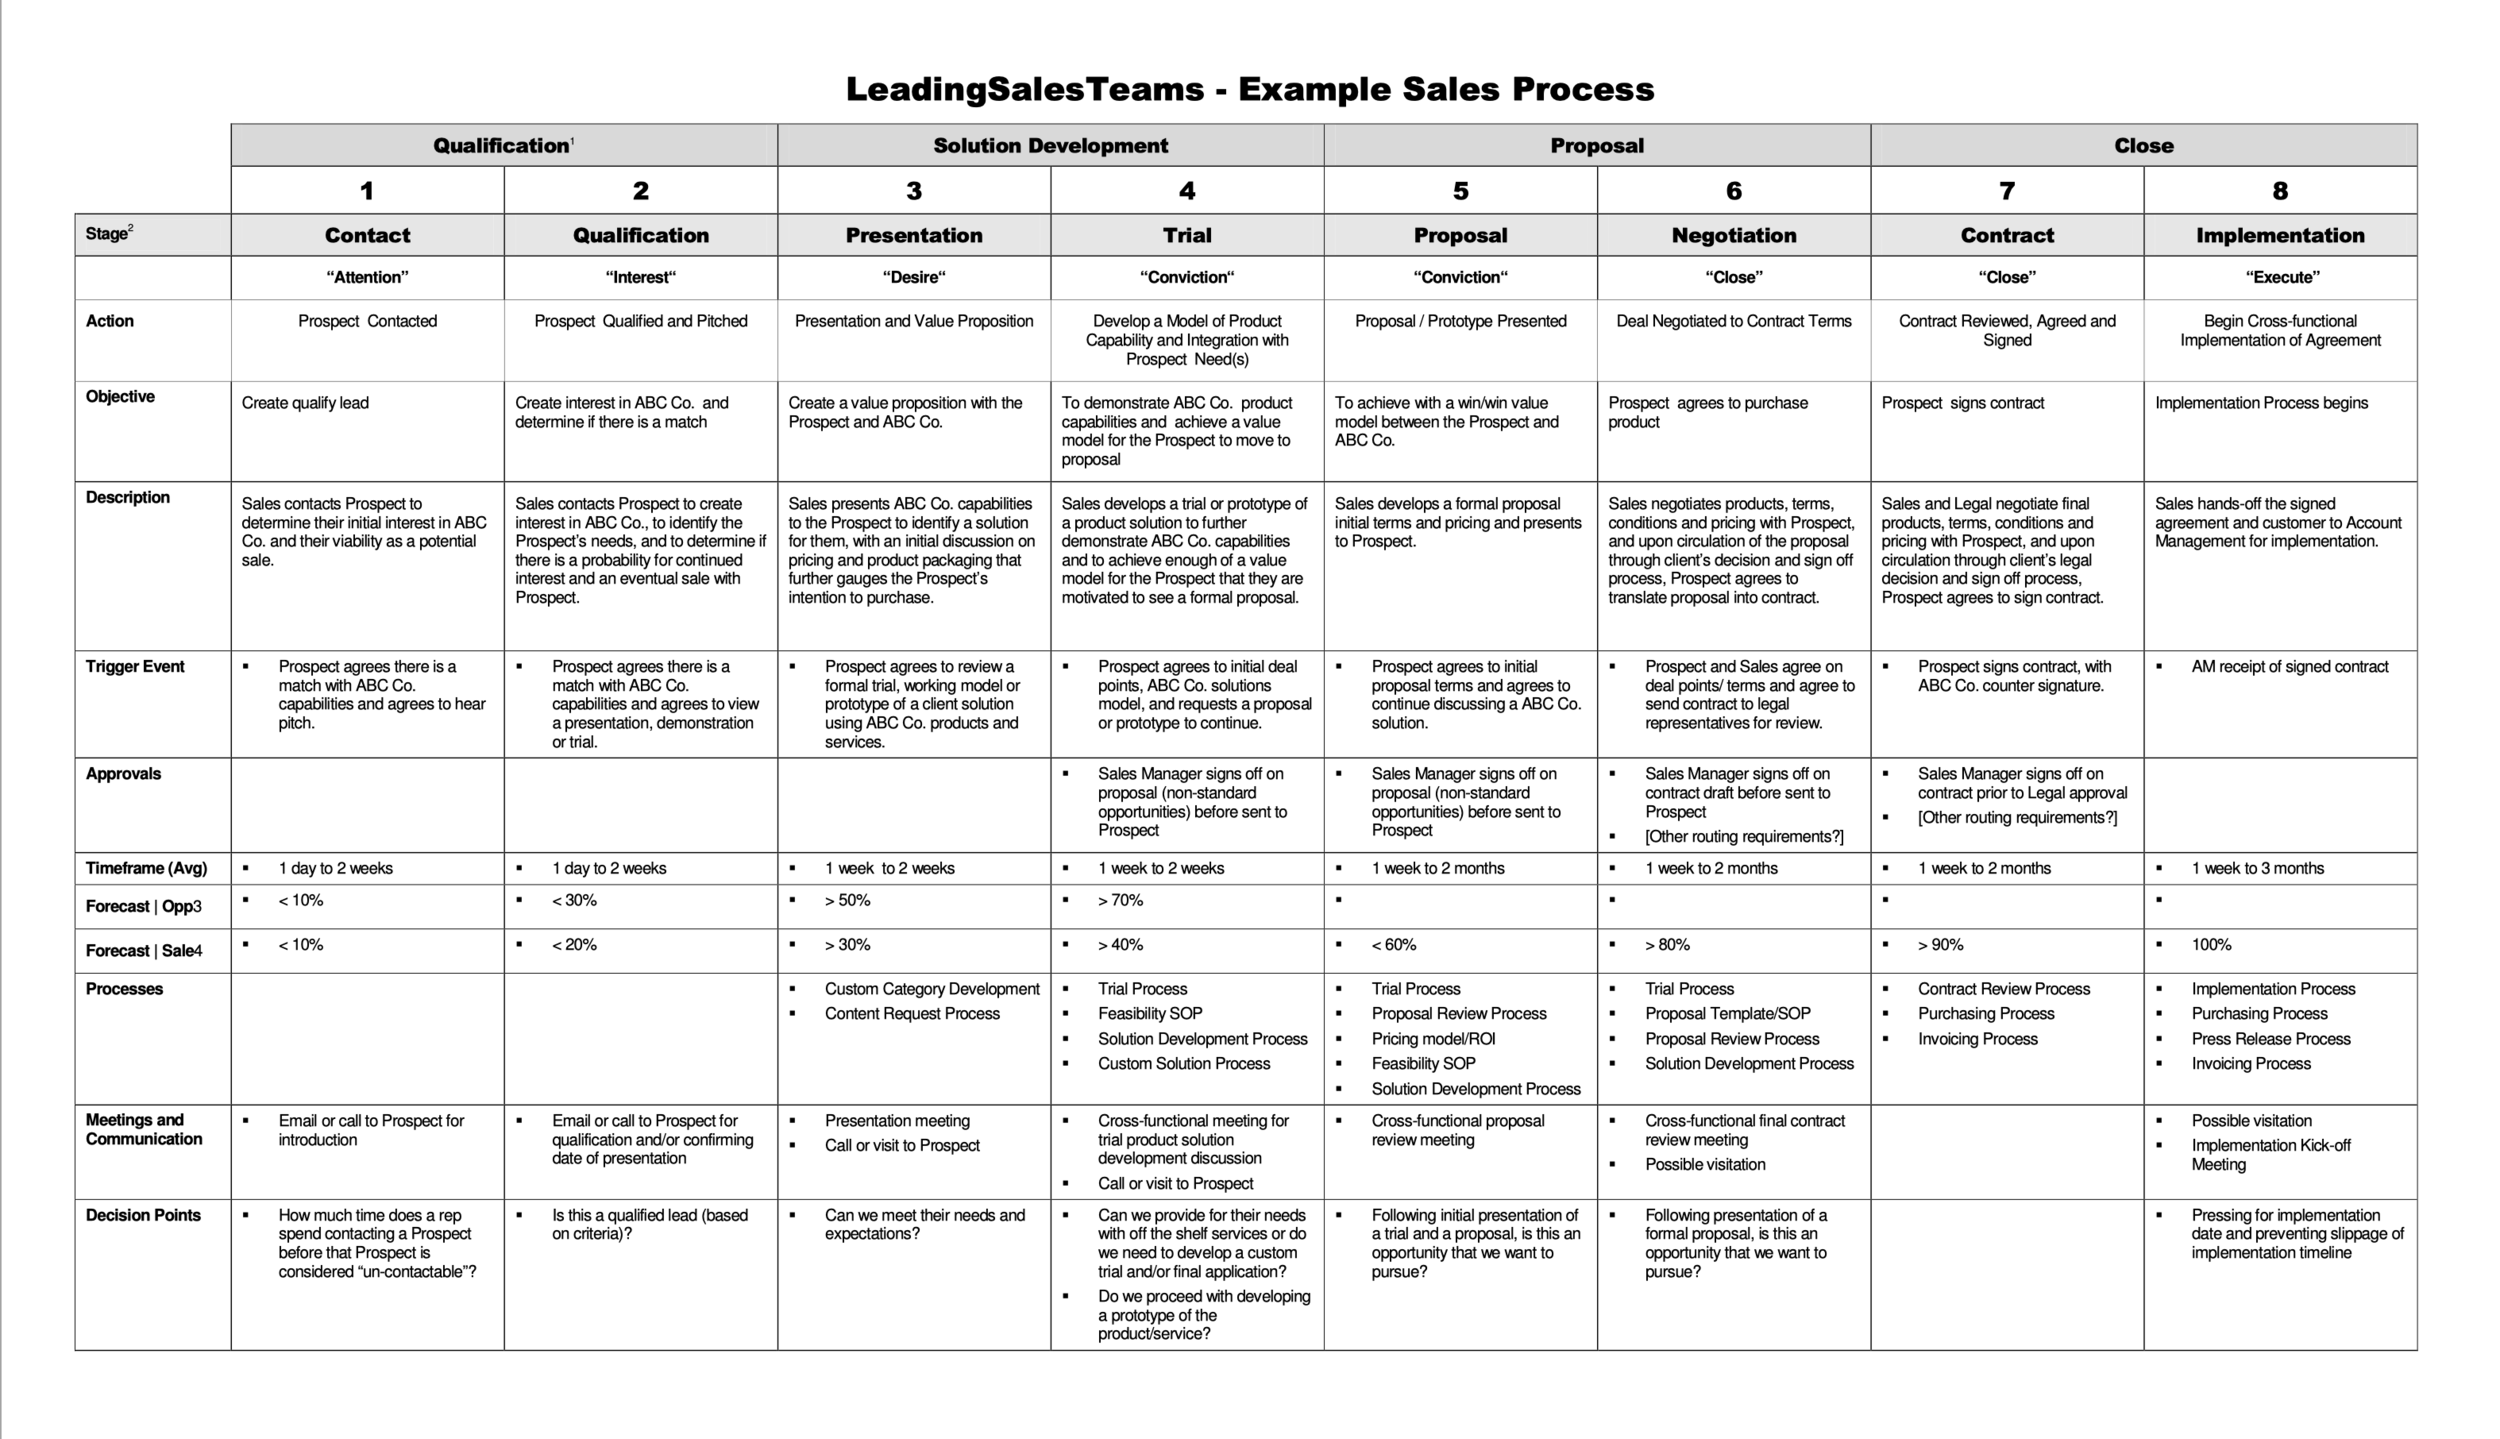
Sales Cross-Functional Responsibilities Matrix
Summary
YellowBrix needed to track revenue from lead generation to initial prospect contact (first sales call), to the sale and implementation of the product on the client site. The purpose of tracking was to:
Accurately forecast revenues in each quarter by following the "deal flow" in the sales and customer implementation process.
Determine how to improve their lead generation process and selection of lead generation sources.
Measure the effectiveness of their sales force automation software and its use by sales personnel.
Result
Mapped the process of generating leads, sales cycle, implementation of the product on the client's site, and ongoing customer relationship management.
Developed a sales force automation program and informational database that followed the company's new revenue process.
Trained all company personnel involved in the revenue process to include the marketing, lead generation, sales, customer service, MIS, and finance departments, on the cross-functional dynamics of revenue generation.
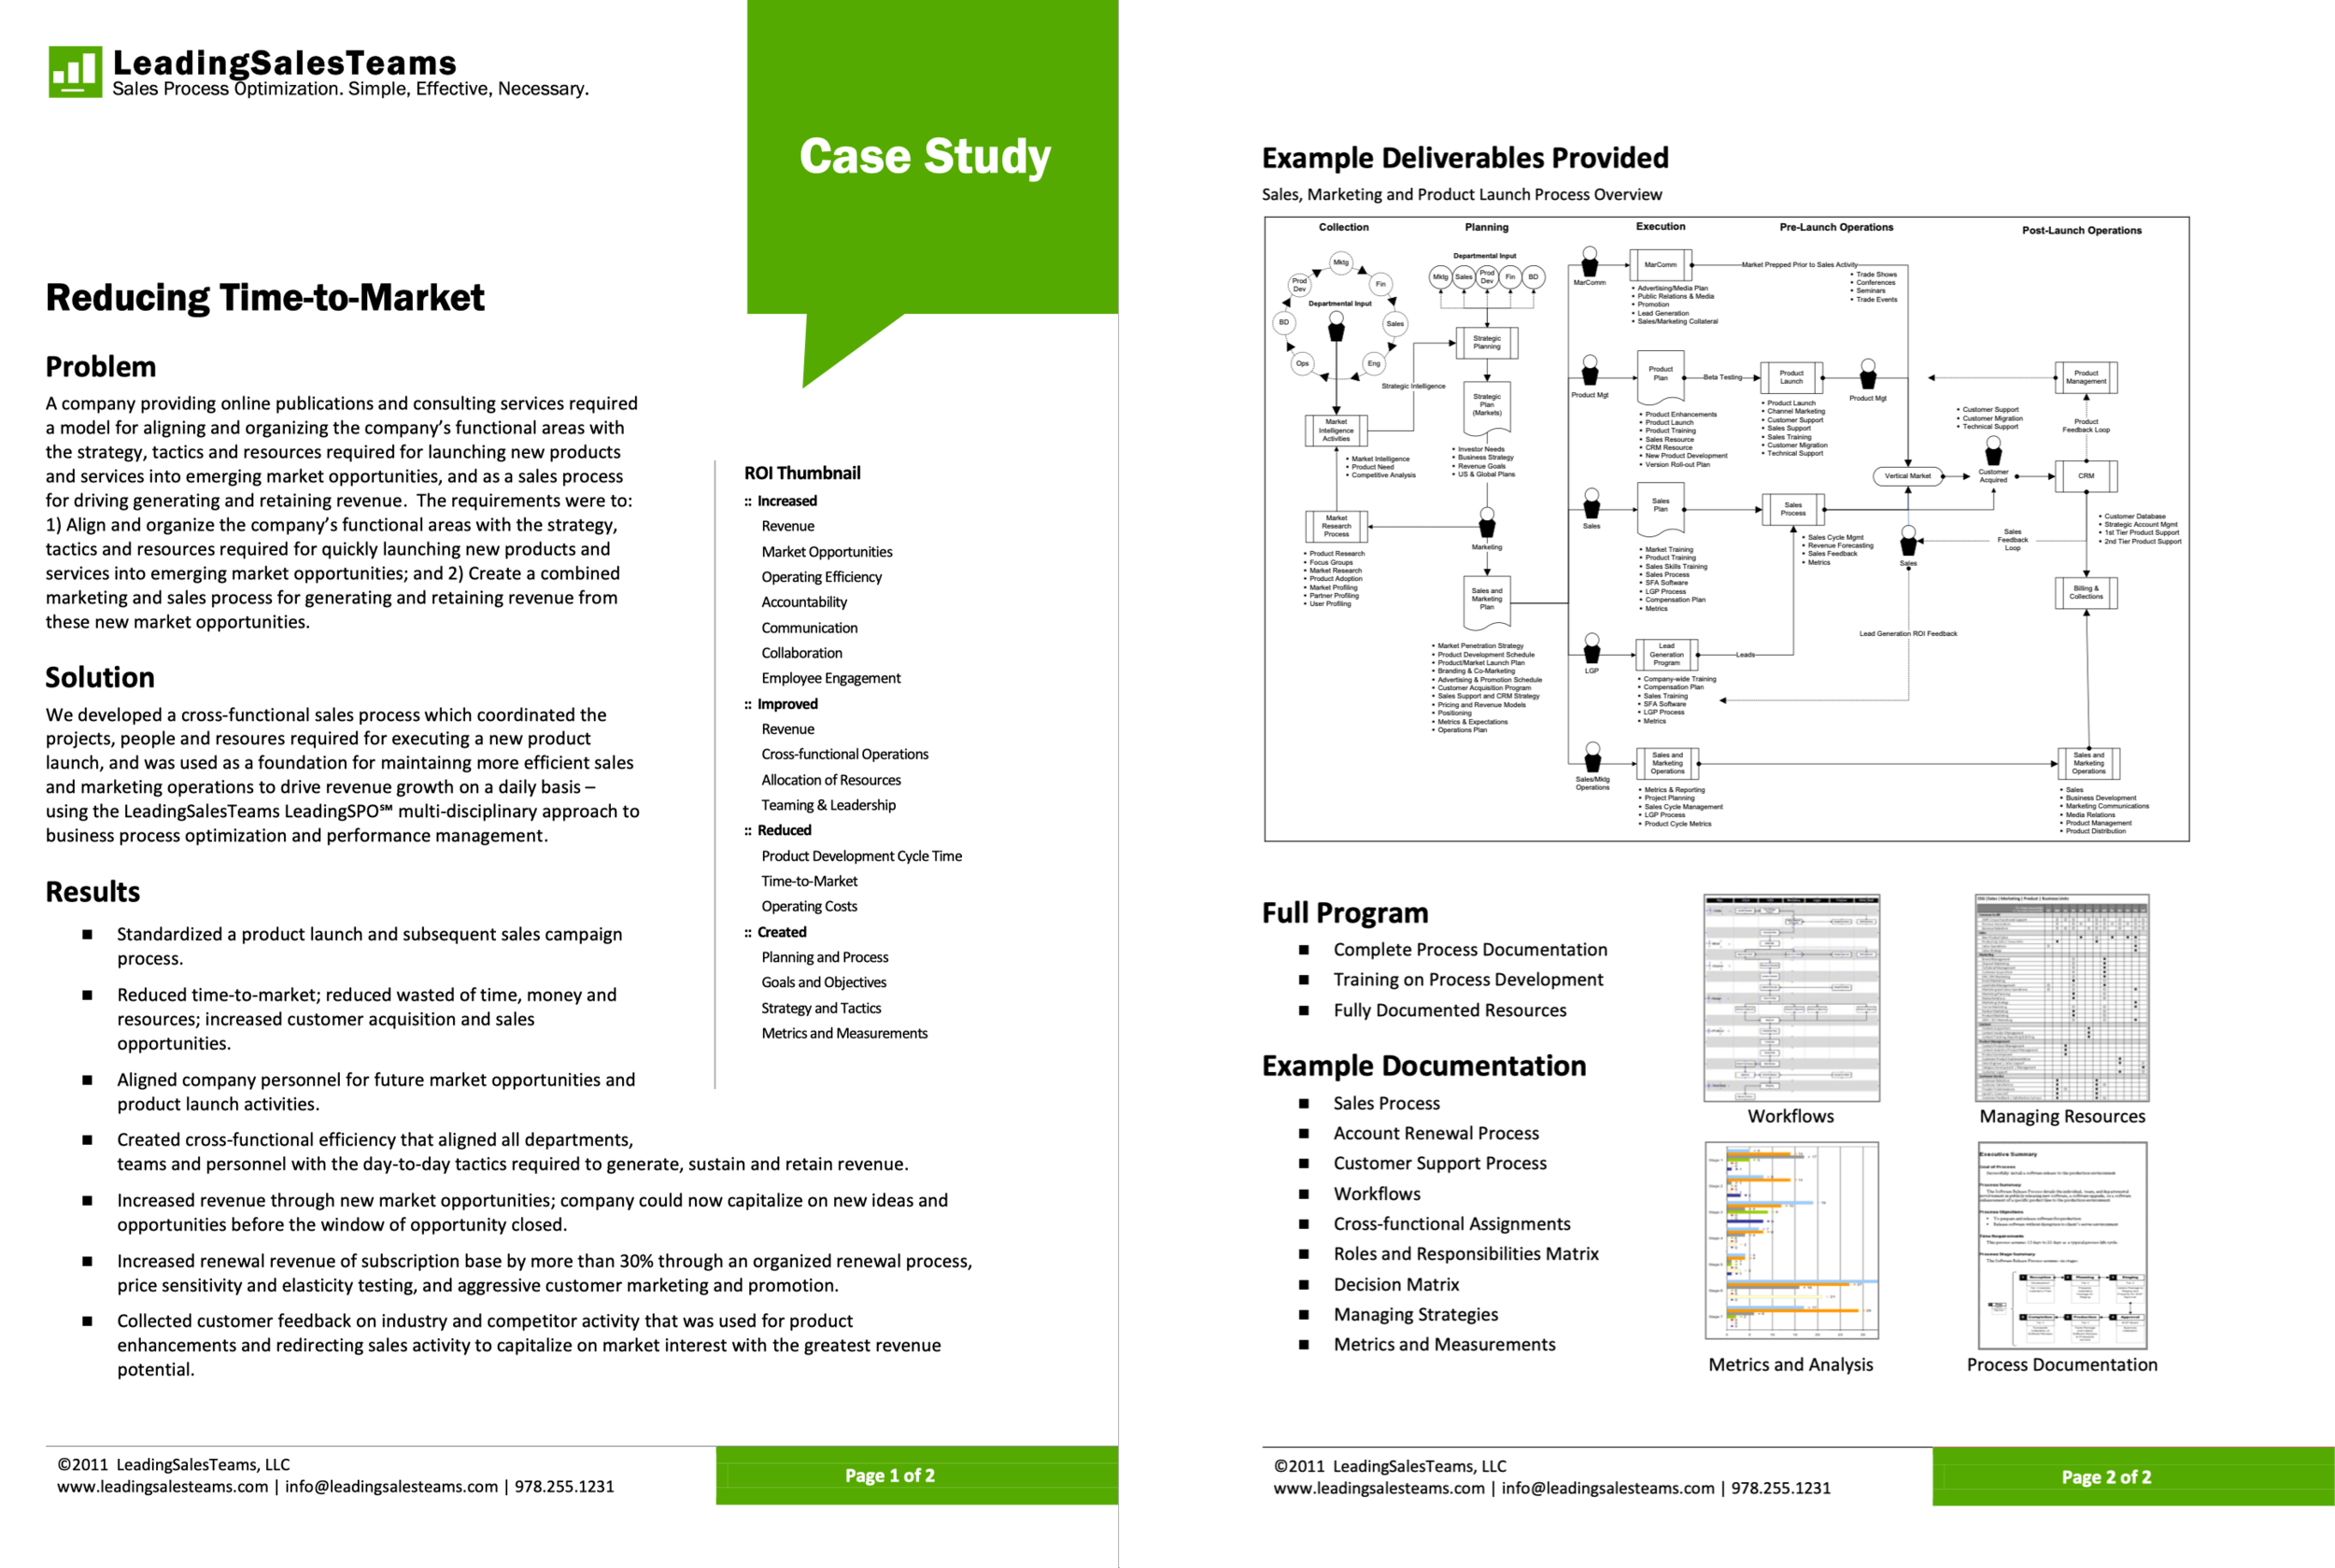
Reducing Time-to-Market
Mapping cross-functional impacts on a program or service launch.

Summary
Mapped how lead generation and prospecting workflow, cycles of steps, and conversion rates.
Result
Created a lead generation process that:
Reduced the cost of customer acquisition.
Increased the quality of the leads generated.
Reduced the sales cycle by generating leads more likely to close within a 30-60-90 day period and thereby reduce the "time to revenue".
Developed a lead generation program, lead generation process, and a systematic lead generation ROI analysis to include a process map, deliverables, and timetable, roles and responsibilities.
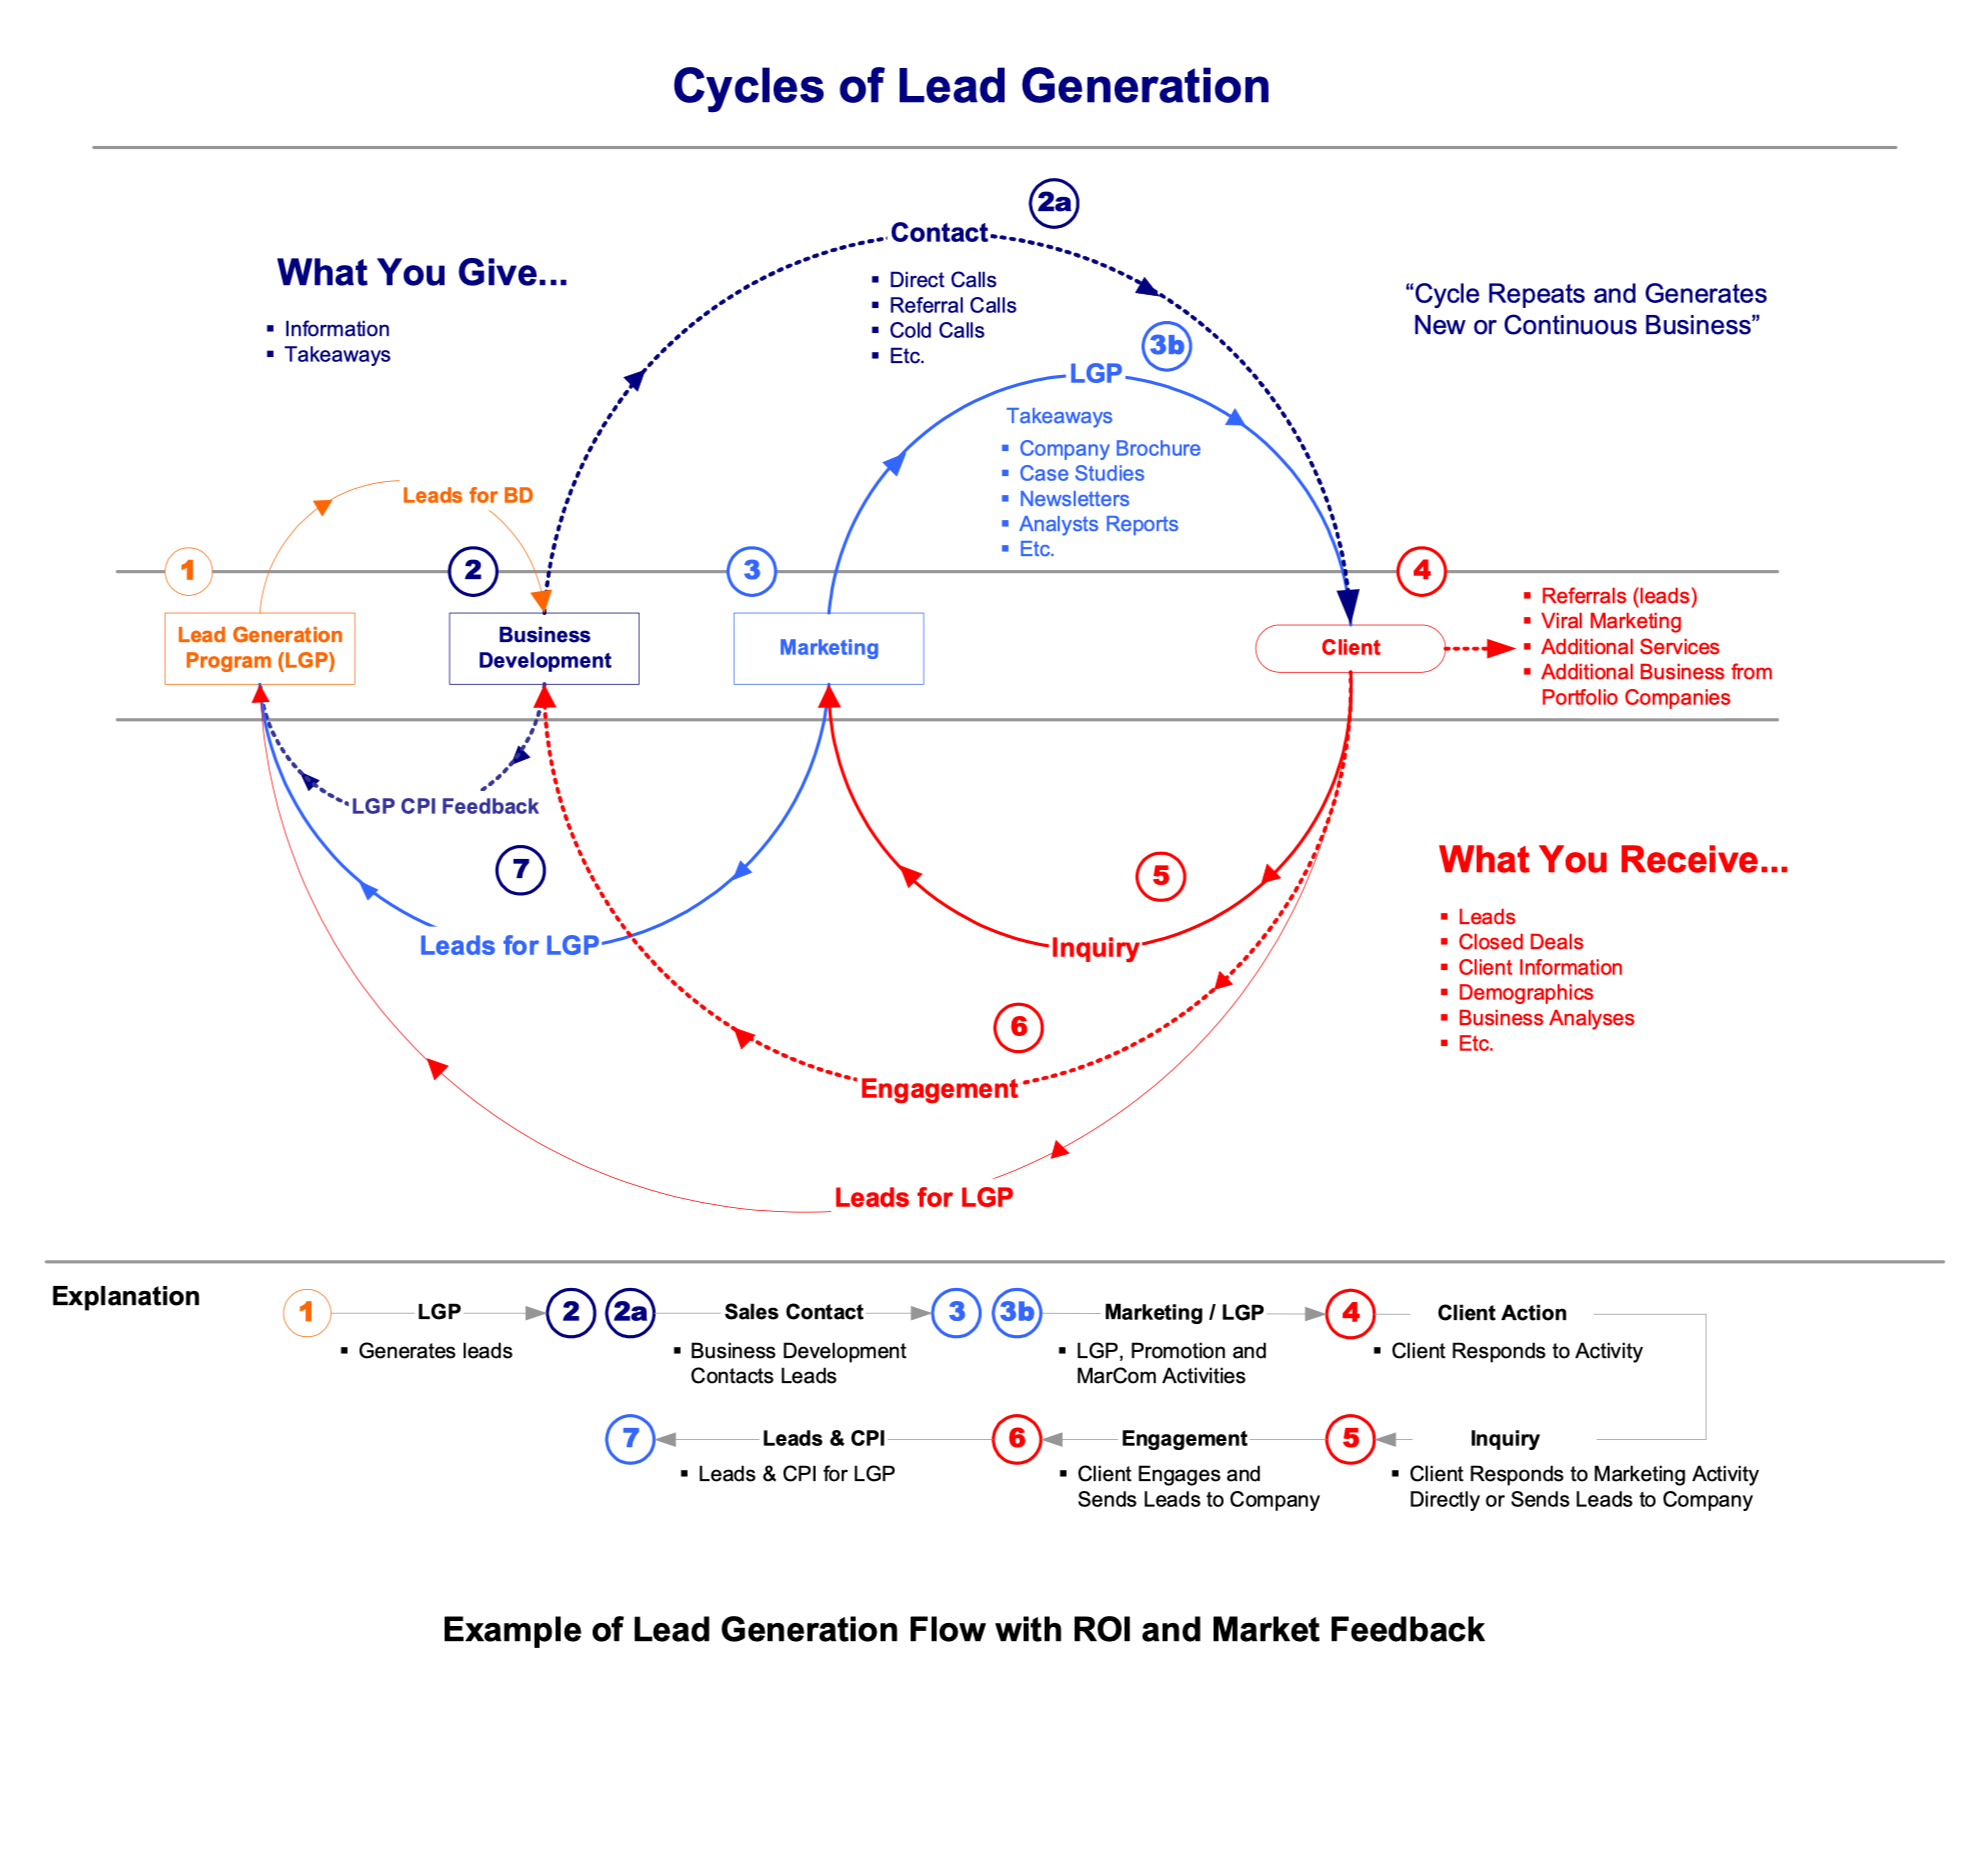
Lead Generation Process
Mapping lead generation to increase conversion rates.
Summary
Mapped how lead generation and prospecting workflow, cycles of steps, and conversion rates.
Result
Created a lead generation process that:
Reduced the cost of customer acquisition.
Increased the quality of the leads generated.
Reduced the sales cycle by generating leads more likely to close within a 30-60-90 day period and thereby reduce the "time to revenue".
Developed a lead generation program, lead generation process, and a systematic lead generation ROI analysis to include a process map, deliverables, and timetable, roles and responsibilities.
Course Enrollment Analysis
Studying 12 months of enrollment to understand promotion cycles.
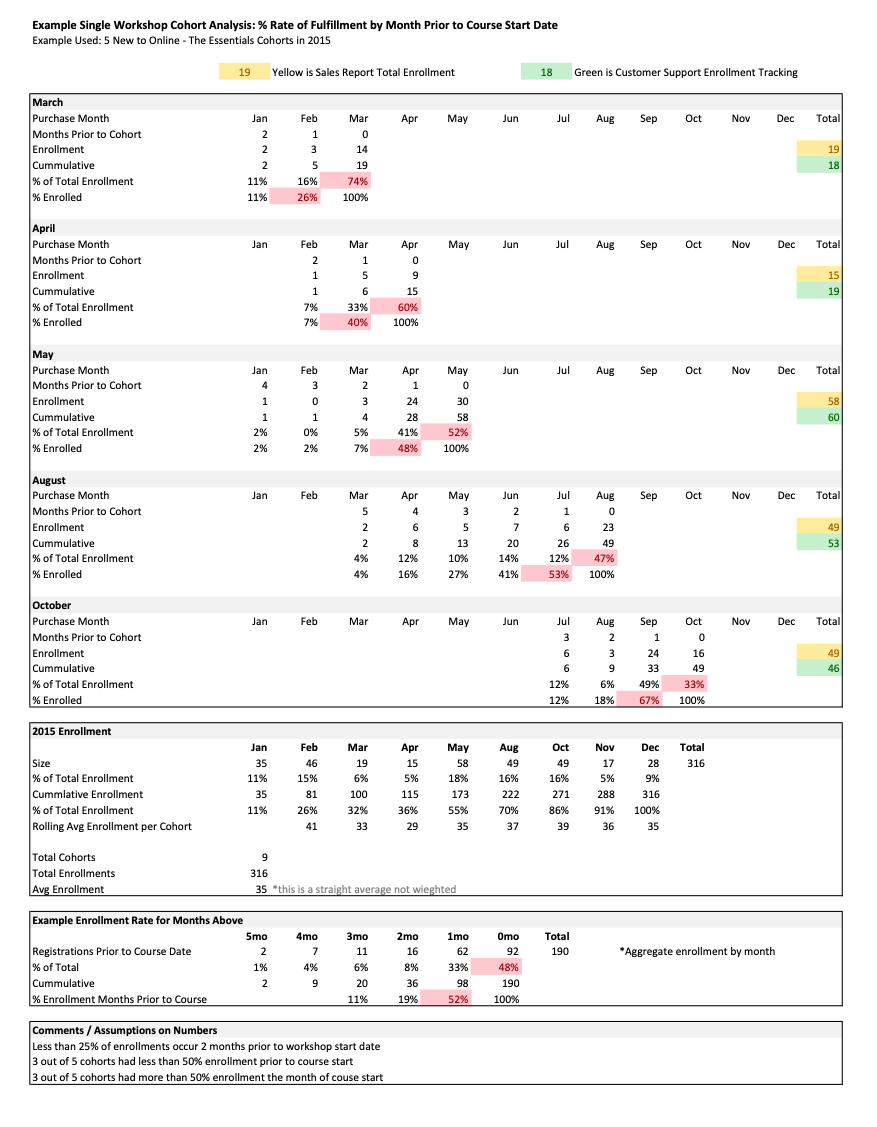
The table provided is a sample of the materials and workflows that were created.
Summary
Mapped how lead generation and prospecting workflow, campaign and promotion cycles, and conversion rates for all 80 courses during the instruction year.
Result
Understood more than 90% of enrollments occurred in the 60 days prior to course start.
Analyses contributed to better promotion cycles and increased conversion of enrollments.
With increased accuracy in projecting enrollments came the ability to project income from enrollment in real time.